What is PerfLoad?
PerfLoad is a self-hosted, no script approach to HTTP load testing —
no k6 scripts, no code to write. You build a test from a curl command or a simple form,
and PerfLoad handles the rest. Under the hood, it runs each test with
k6. It runs locally (or on a
server you control) via Docker and gives you two views: a Workbench for authoring detailed
test definitions, and a Dashboard for quick one-off runs and reviewing past results.
Installation
PerfLoad runs entirely via Docker — no Chrome extension required. The Chrome Extension below is just an optional shortcut for opening the Workbench tab.
1. Run the container:
docker run -p 3000:3000 -v perfload-runs:/app/runs perfload/perfload-runner:latest
2. Open the Workbench:
http://localhost:3000/load-tester.html
→ Full installation guide (Docker & Kubernetes)
Watch it in action
A quick walkthrough of installing PerfLoad and running your first test:
Workbench
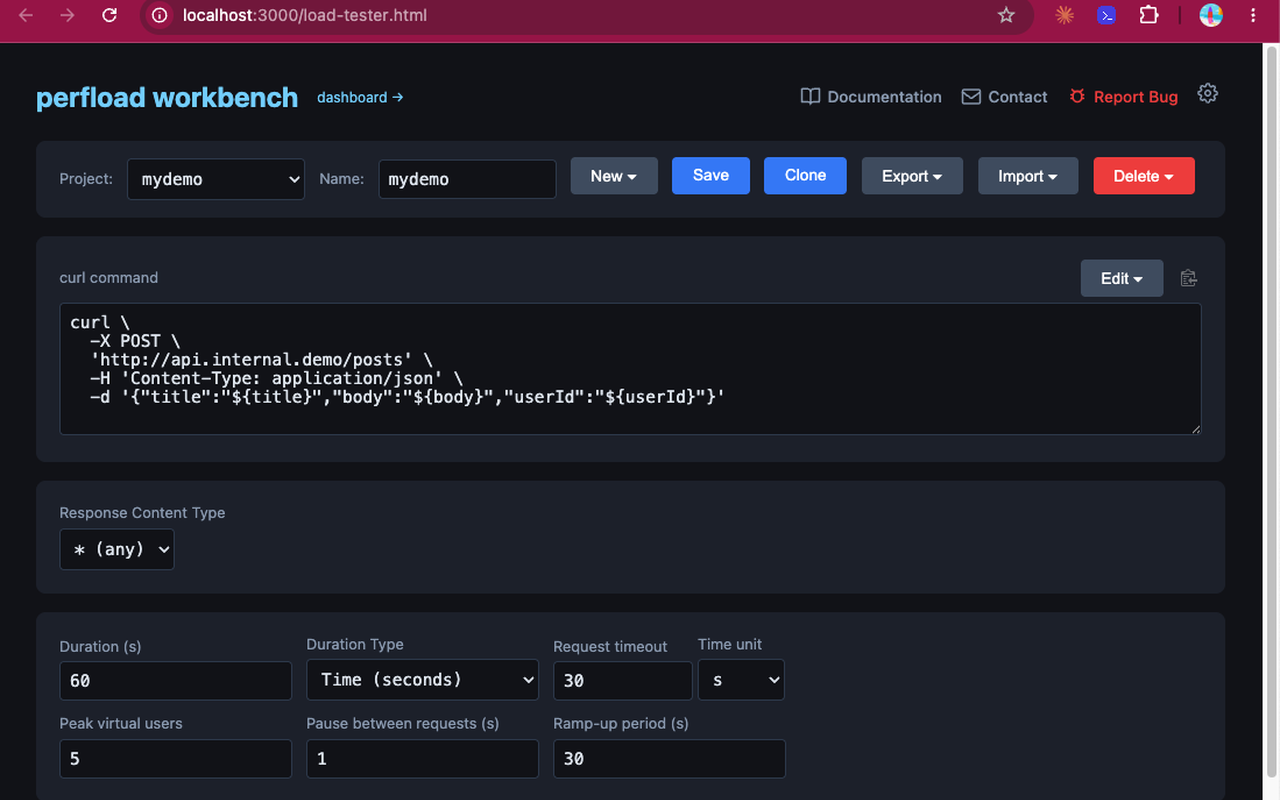
Write or paste a curl command directly, then layer a load profile on top of it:
- Save, clone, import, and export named test projects
- Set duration, peak virtual users, ramp-up period, and pause between requests
- Define headers, auth, and variables — including auto-extracting values from responses to feed into later requests
- Validate responses by content type
Dashboard
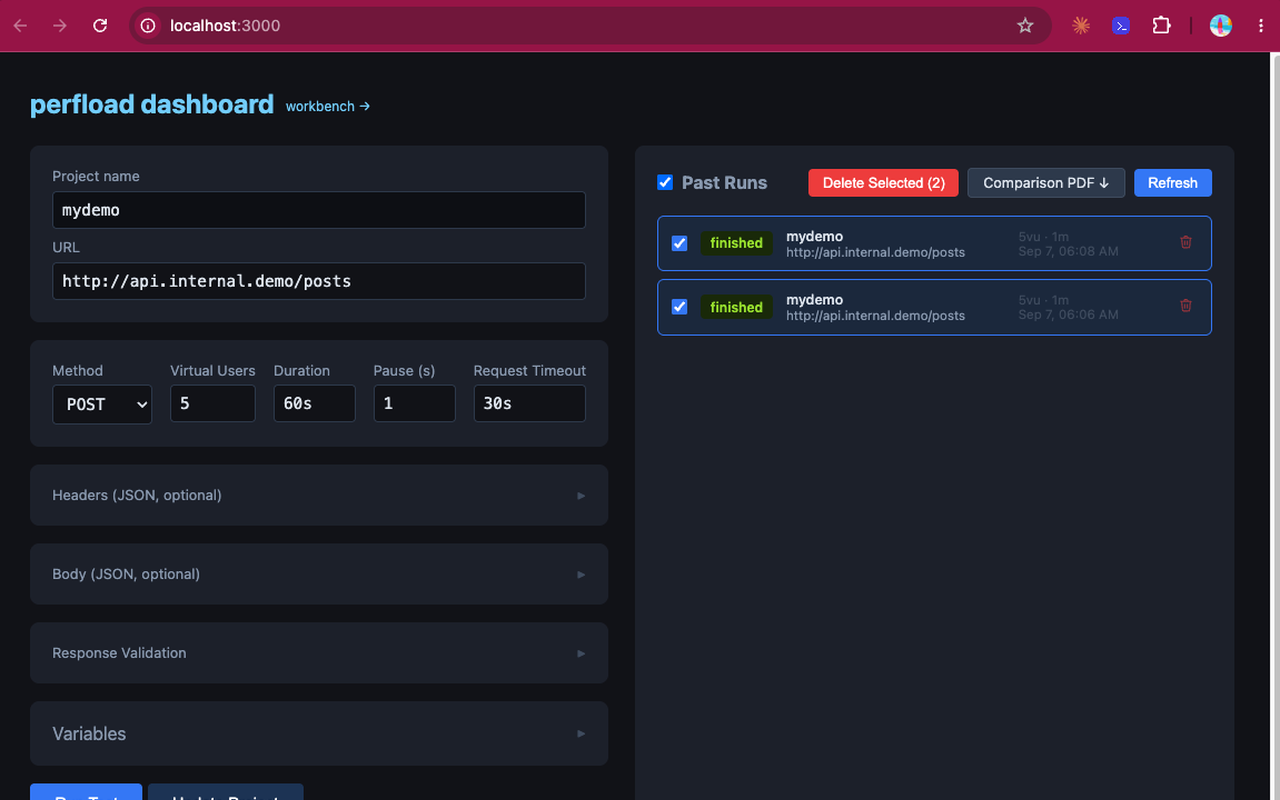
A lighter-weight form for quick tests without setting up a saved project:
- Pick a method, target URL, virtual users, duration, pause, and request timeout
- Attach JSON headers and body, plus response validation
- Review past runs alongside the form
Powered by k6
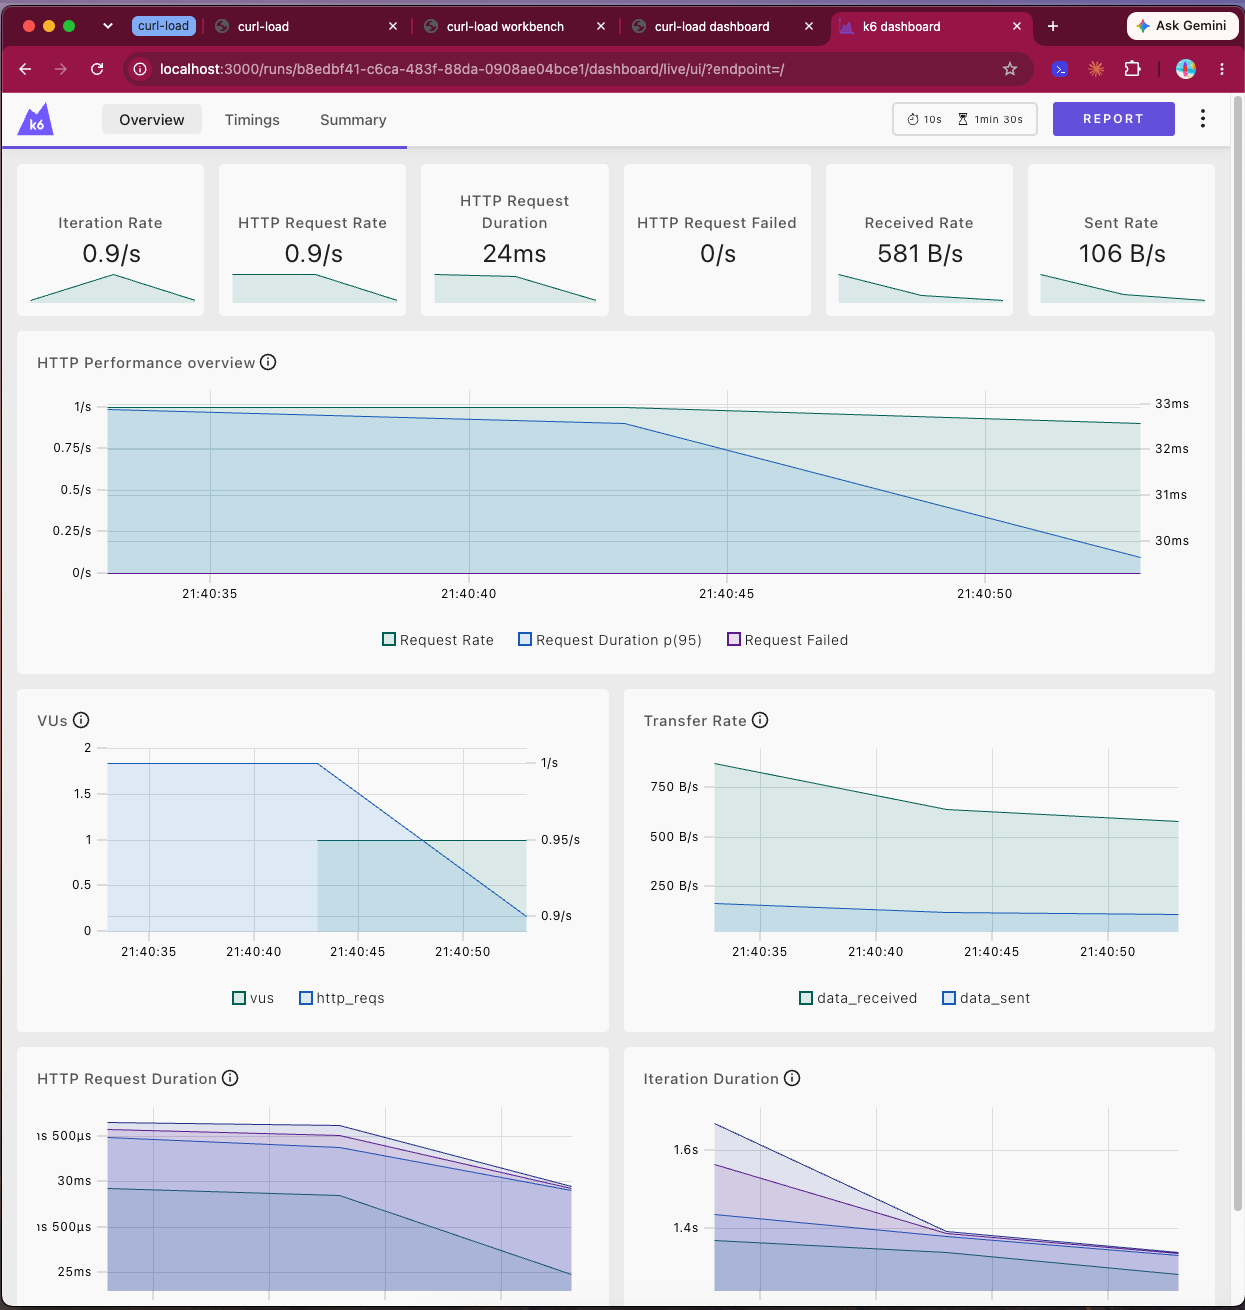
Both the Workbench and the Dashboard hand your test off to k6 to actually run it. While a test is in progress, PerfLoad links out to k6's own live dashboard for real-time metrics — request rate, duration, virtual users, and transfer rate — and every run's results are backed by k6's output.
AI-friendly
PerfLoad ships two built-in skill files — /skills/workbench.md and
/skills/dashboard.md — that let AI browser tools — like
Claude in Chrome —
drive each view directly from a prompt, instead of you clicking through it yourself.
Run tests with a prompt
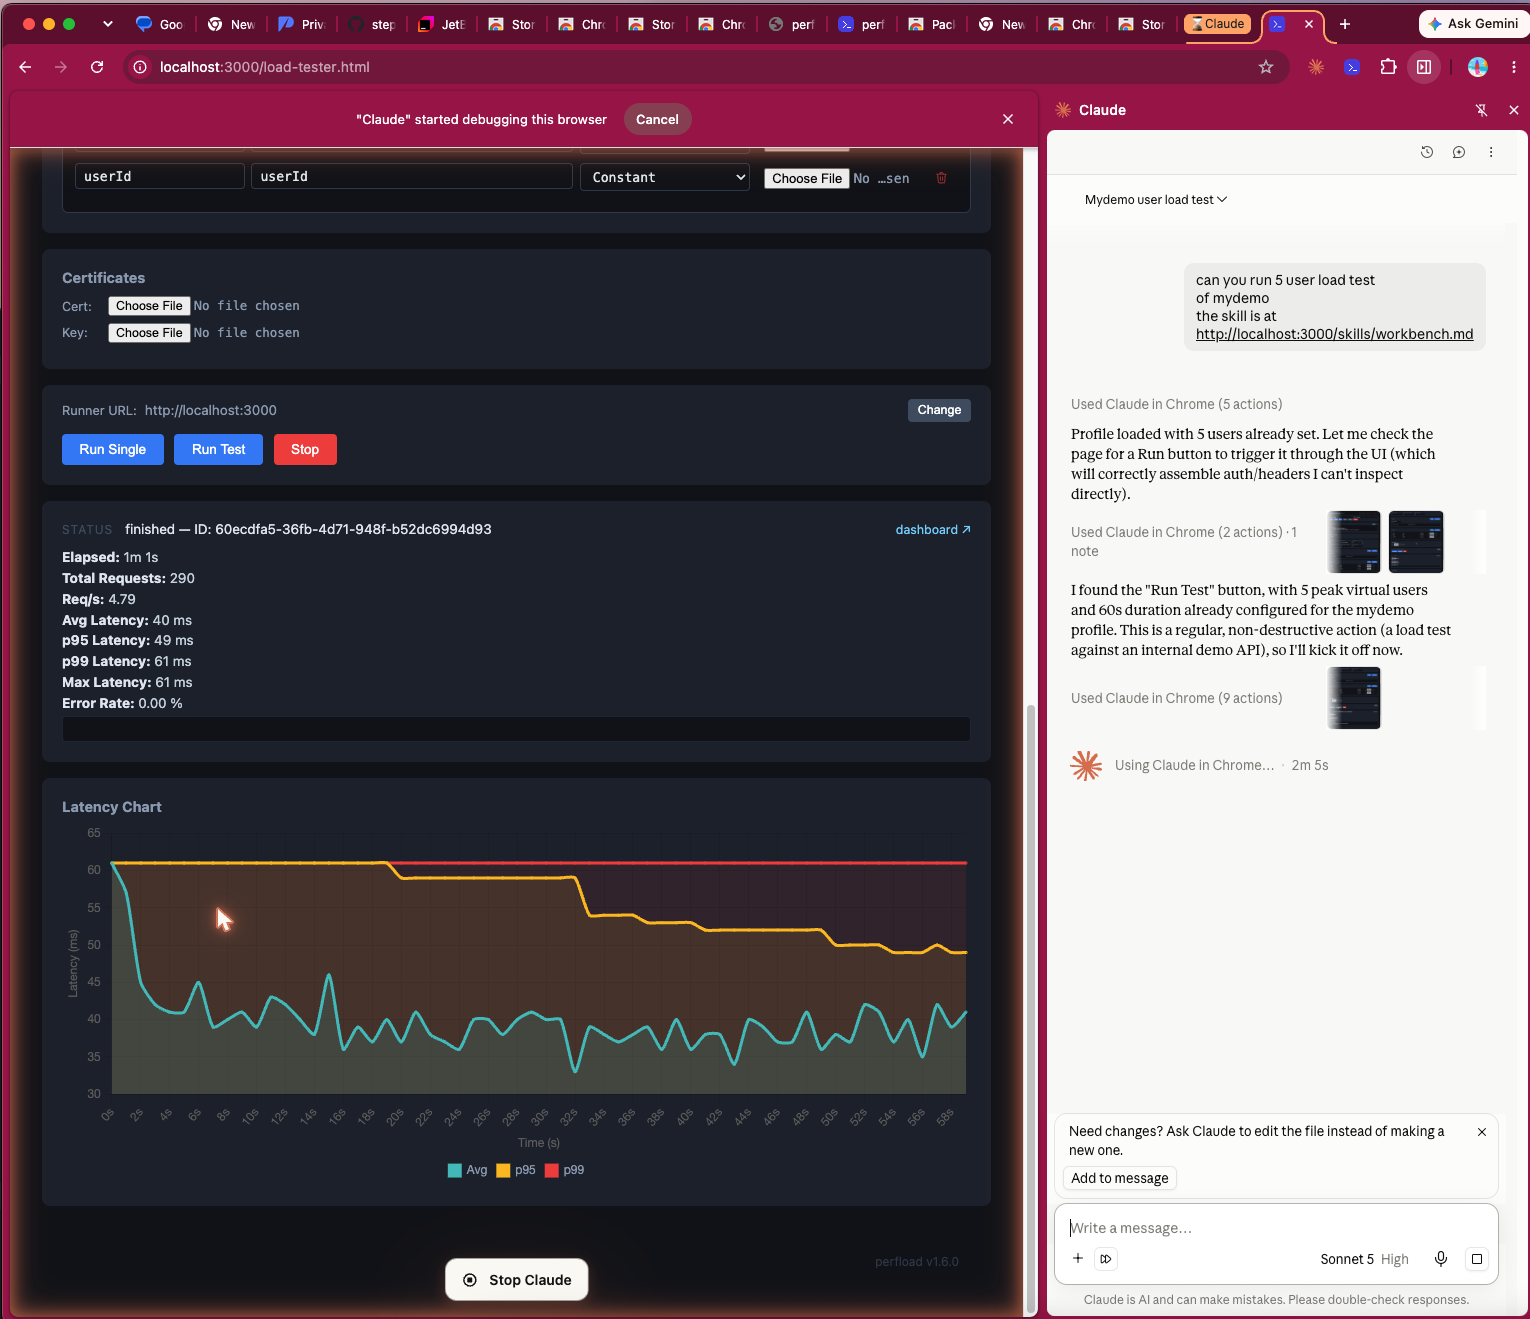
The /skills/workbench.md skill describes how to operate the Workbench. Point an AI
browser tool at it, describe the test you want in plain language, and it fills in the form and
starts the run for you — then reads back the results.
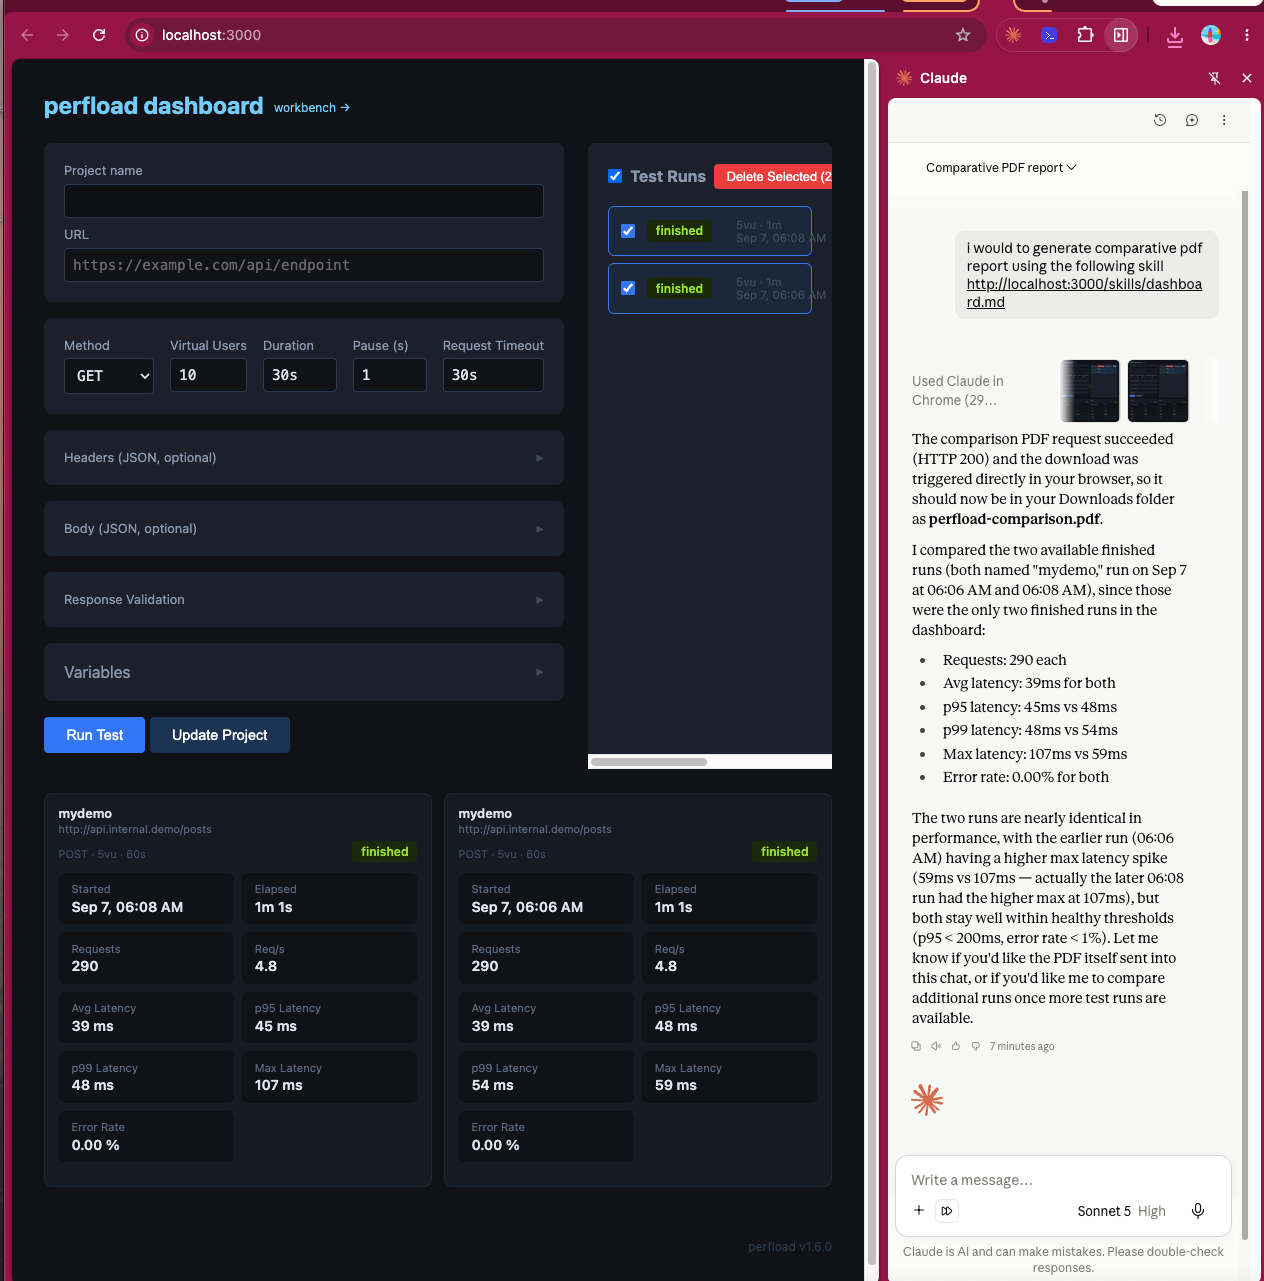
Compare runs with a prompt
PerfLoad can already export a PDF report for any single run. The /skills/dashboard.md
skill covers the Dashboard's run history — ask it to compare two or more runs, and it pulls in each
one's results, works out the delta on every metric, and hands you back PerfLoad's own report
format with the comparison included.
Performance Testing for AI Coding Agents
PerfLoad MCP — Now available
Bring performance testing directly into your AI-powered development workflow.
With Model Context Protocol (MCP) support, AI coding agents can create, execute, and analyze load tests using PerfLoad.
From a simple cURL command to actionable performance insights, PerfLoad makes load testing accessible to both developers and AI agents.
- AI Agent Integration Works with MCP-enabled tools such as Claude Code and Cursor.
- Natural Language Testing Ask your AI agent to create and execute load tests.
- cURL to Load Test Convert existing API requests into performance tests.
- Performance Analysis Retrieve response times, throughput, error rates, and performance metrics.
- Regression Detection Compare test runs to identify potential performance regressions.
- Automated Workflows Integrate performance testing into AI-assisted development and CI/CD workflows.
Chrome Extension
The PerfLoad Workspace Launcher is a one-click shortcut that opens your PerfLoad Workbench in Chrome, grouped under a "perfload" tab group. Add it from the Chrome Web Store, or see the extension page for details, requirements, and permissions used.
Multiuser New
PerfLoad now supports multiple users. See the Multiuser page for details.
Guides
- curl load test — turn a curl command into a repeatable load test
- API load testing — test REST APIs without writing a script first
- curl to k6 — run an existing curl request as a k6 load test
- k6 alternative — how PerfLoad and k6 compare
- CI/CD load testing — replay a saved baseline test on every deploy
- GitHub Actions load testing — a workflow that exposes p95 latency
- Self-hosted load testing — run the runner inside your own network
- HTTP load testing tool — how an HTTP load test works and how to read the results
- Load testing tool overview — what PerfLoad includes and who it suits
- Website load testing — load test a URL, and what that does and doesn't measure
- REST API load testing — GET, POST, PUT, PATCH, and DELETE with realistic data
Support
Questions, bug reports, or feature requests — reach out at support@perfload.io.